My Market Graphs - Screenshot Tour
My Market Graphs

Screenshot Tour
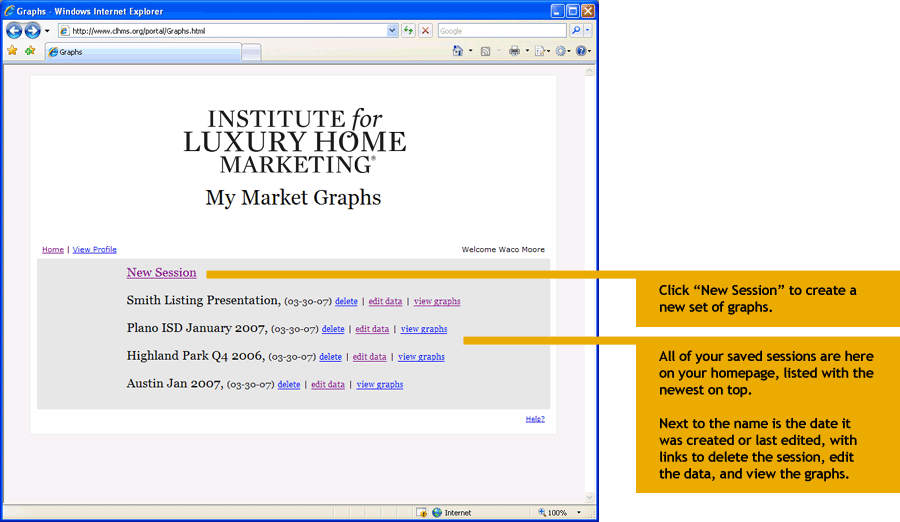
Screen 1: Your Home Page
Below is the homepage for My Market Graphs. This is what you see when you log in.
It features a simple list of all of your saved "sessions"--the graphs you have created and the data you have entered.
You can create new graphs by clicking on the "New Session" link.


Screen 2: Data Entry
This is the data entry screen. Six simple steps and that's it.


Screen 3: Graphs
After you enter you data and click "Save and View Graphs" (above) the system automatically generates all the graphs and displays them on this screen. Here you can download, print and add comments to any and all of the graphs.


Screen 4: Formatted to Print
Nicely formatted pages to print.